Well, there isn't much going on to talk about weather-wise. Things has been so boring this winter that I've already resigned to the fact this winter is a complete, utter failure for us snow lovers in North Carolina. Asheville typically average around 13 inches of snow per winter, but we only managed 5.5" inches so far here on UNC-Asheville campus. Most of that snow actually came from a freak upper level low event on the first day of November that gave widespread snow to I-26 cities from Sams Gap, NC/TN all the way down to Lexington, SC. In fact, Lexington has seen more snow than anybody in North Carolina outside Blue Ridge mountains and the only time they saw flakes was the day after Halloween. That's how you know this winter was a big phony. I've already given up on models watching for any hint of major snowstorm in state of North Carolina and moved onto my favorite time of the year: severe weather season.
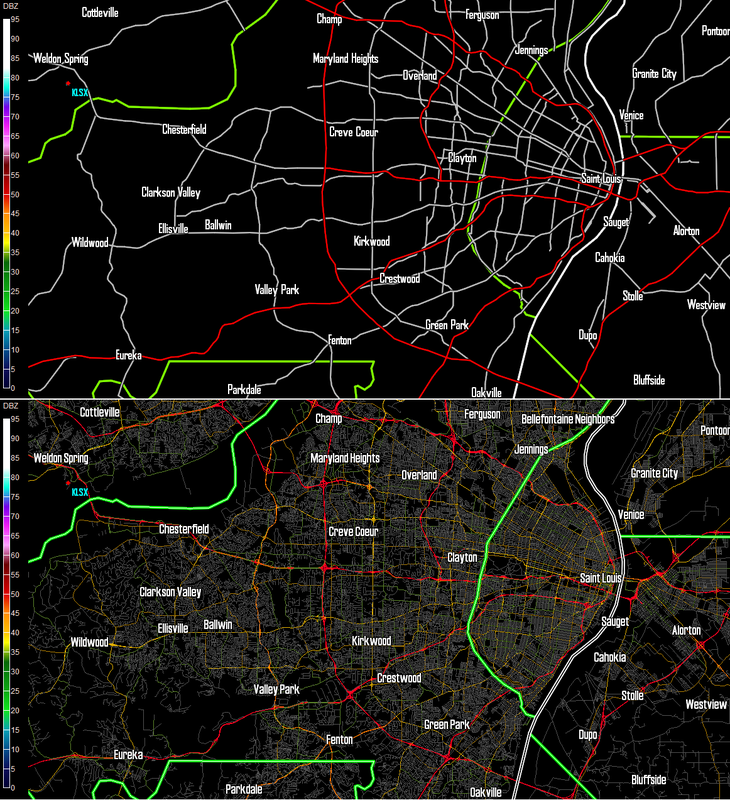
Over the past few months, I've been busy overhauling my GR2Analyst, an expensive radar program to track weather events across this country. I've changed outlines for counties/states, tweaked my color tables for various products, and downloaded Open Street Map shapefiles from Iowa State University's meteorology website for every single radar sites between Rockies and Appalachians. In an individual shapefile, you get a well-detailed network of roads for 150 miles from a certain radar site somewhere in Central United States. The downside of this amazing additional is each shapefile contains anywhere between 50-100 megabytes of data so downloading ~50 shapefiles and installing them to GR2Analyst took almost all of my free time in the past few days. I also ran into issues with Texas roads and had to ask developer of those shapefiles for a help. I was very exhausted by the time I was done downloading those files, but it was worth the effort before this severe season get rolling. Why? See for yourself:
Over the past few months, I've been busy overhauling my GR2Analyst, an expensive radar program to track weather events across this country. I've changed outlines for counties/states, tweaked my color tables for various products, and downloaded Open Street Map shapefiles from Iowa State University's meteorology website for every single radar sites between Rockies and Appalachians. In an individual shapefile, you get a well-detailed network of roads for 150 miles from a certain radar site somewhere in Central United States. The downside of this amazing additional is each shapefile contains anywhere between 50-100 megabytes of data so downloading ~50 shapefiles and installing them to GR2Analyst took almost all of my free time in the past few days. I also ran into issues with Texas roads and had to ask developer of those shapefiles for a help. I was very exhausted by the time I was done downloading those files, but it was worth the effort before this severe season get rolling. Why? See for yourself:
The top picture was before I started working on GR2Analyst a couple months back. This network of roads was a default that came with the program and I was not satisfied enough with lack of details, so I downloaded files from Iowa State University to improve on roads in GR2Analyst. I also didn't like how my county/state lines wasn't standing out well, so I simply made a couple minor changes to them. CIA font also had to go, so I changed them to Haettenschweiler for more professional looking letters. Looking at the bottom image, I'm pretty happy with updates I've done over the past couple of months so far. There are some some work still to be done before this severe weather season, such as designing new graphics, adjusting warning lines, and downloading severe thunderstorm/tornado watch shapefiles. Currently, I'm designing a new graphic with a key for different warnings so I can share my radar screenshots of an ongoing event to my social media followers on @UNCAWeather, @KyleNoel15, and my personal Facebook page. Here's an example of my work-in-process graphic in use during Tuscaloosa tornado on April 27, 2011:
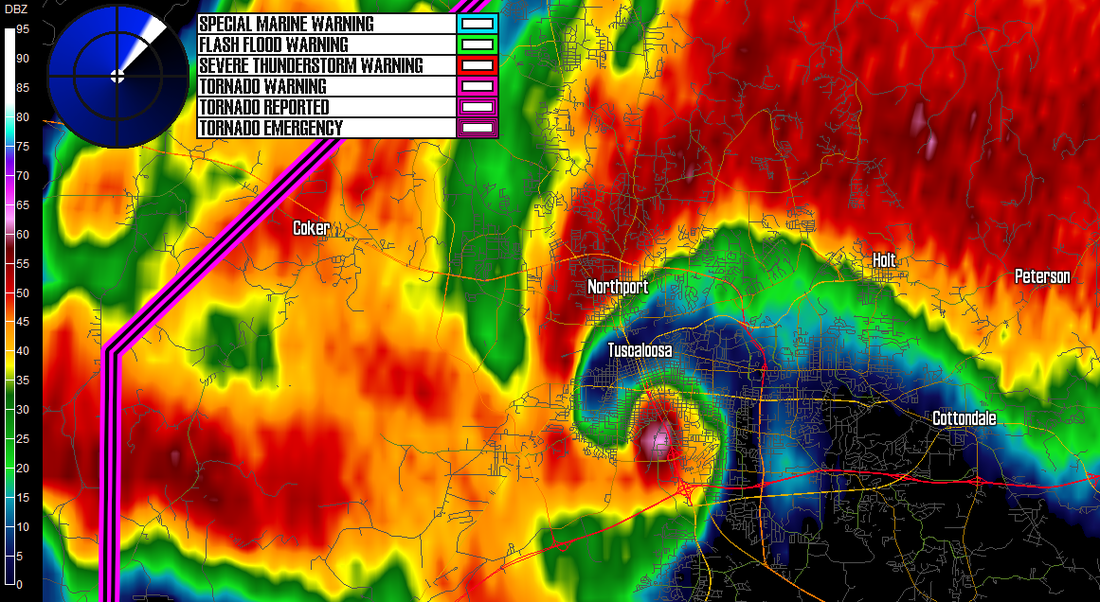
As you can see, my brand new network of roads looks wonderful on this image. It's clear that a major tornado (located somewhere under pink debris ball) is moving across downtown Tuscaloosa at this moment. However, my graphic didn't explained clearly why there's a triple pink lines on the map. Those lines represented a ultra-rare tornado emergency that was ongoing for Tuscaloosa at that time. What I got in my mind is to re-classify both tornado reported and tornado emergency on GR2Analyst to tornado warning because it's simple enough my social media followers to understand. It shouldn't take for a tornado to be reported or an emergency to be declared before taking any action for yourself and your family. In additional to that, I will be working on making my graphic look nicer so it's not just a logo and a key. It's too bad I'm just writing about updates to my little computer toy instead of explaining why Raleigh or Asheville will get a foot of snow few days from now, but I hope y'all still enjoy what I got to write about! Thanks for reading!
 RSS Feed
